In case of Chi Square test of independence I will use the
same research question as last post, which is if female employment rate is
associated with polity score of a country. The NULL hypothesis being: there is
no association between female employment rate and polity score. In the
GAPMINDER data set both these fields are numeric. In order to do a Chi Square
test I had to categorize these fields.
Polity Score Categories -
Autocracies: -10 to -6
Anocracies: -5 to 5
Democracies: 6 to 10
The categories are obtained from the definition of Polity
score in Wikipedia.
Code
# -*- coding: utf-8 -*-
"""
Created on Sun Nov  8 13:54:31 2015

@author: Abhishek
"""
import pandas
import scipy.stats
import seaborn
import matplotlib.pyplot as plt

data = pandas.read_csv('gapminder.csv', low_memory=False)
pandas.set_option('display.float_format', lambda x: '%f'%x)

data['femaleemployrate'] = data['femaleemployrate'].convert_objects(convert_numeric=True)
data['polityscore'] = data['polityscore'].convert_objects(convert_numeric=True)

data['polityscore'] = pandas.to_numeric(data['polityscore'], errors='coerce')
data['polity_cat'] = pandas.cut(data.polityscore, [-10, -6, 5, 10], labels=['autocracy', 'anocracy', 'democracy'])

data['femaleemployrate'] = pandas.to_numeric(data['femaleemployrate'], errors='coerce')
data['femaleemployrate_cat'] = pandas.cut(data.femaleemployrate, [0, 25, 75, 100], labels=['low', 'medium', 'high'])

ct=pandas.crosstab(data['femaleemployrate_cat'], data['polity_cat'])
print(ct)
print('--------------------------------------------------------------')

# column sum
colsum = ct.sum(axis=0)
colpct = ct/colsum
print(colpct*100)
print('--------------------------------------------------------------')

# Chi Square
print('chi square value, p value, expected count')
cs = scipy.stats.chi2_contingency(ct)
print(cs)

data["polity_cat"] =data["polity_cat"].astype('category')
data["femaleemployrate_cat"] = data["femaleemployrate_cat"].convert_objects(convert_numeric=True)

plt.xlabel('Polity Score')
plt.ylabel('Female Employment Rate')
seaborn.factorplot(x="polity_cat",y="femaleemployrate",data=data,kind="bar",ci=None)

print()
print()

# Post Hoc Test
print('---------------------------------------------------------------')
print('                      Post Hoc Test                            ')
print('---------------------------------------------------------------')

recode = {'autocracy': 'autocracy', 'anocracy': 'anocracy' }
data['comp1'] = data['polity_cat'].map(recode)
ct = pandas.crosstab(data['femaleemployrate_cat'], data['comp1'])
print(ct)
print('--------------------------------------------------------------')
colsum = ct.sum(axis=0)
colpct = ct/colsum
print(colpct*100)
print('--------------------------------------------------------------')

print('chi square value, p value, expected count')
cs = scipy.stats.chi2_contingency(ct)
print(cs)
print('--------------------------------------------------------------')
print('--------------------------------------------------------------')

recode = {'autocracy': 'autocracy', 'democracy':'democracy' }
data['comp2'] = data['polity_cat'].map(recode)
ct = pandas.crosstab(data['femaleemployrate_cat'], data['comp2'])
print(ct)

print('--------------------------------------------------------------')
colsum = ct.sum(axis=0)
colpct = ct/colsum
print(colpct*100)
print('--------------------------------------------------------------')
print('chi square value, p value, expected count')
cs = scipy.stats.chi2_contingency(ct)
print(cs)
print('--------------------------------------------------------------')
print('--------------------------------------------------------------')

recode = {'anocracy': 'anocracy', 'democracy':'democracy' }
data['comp3'] = data['polity_cat'].map(recode)
ct = pandas.crosstab(data['femaleemployrate_cat'], data['comp3'])
print(ct)

print('--------------------------------------------------------------')
colsum = ct.sum(axis=0)
colpct = ct/colsum
print(colpct*100)
print('--------------------------------------------------------------')
print('chi square value, p value, expected count')
cs = scipy.stats.chi2_contingency(ct)
print(cs)
Initial result of Chi Square test
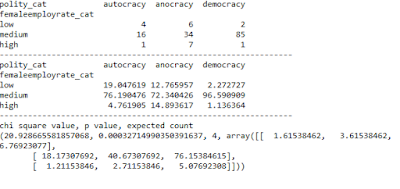
This result shows the crosstab function of female employment rate categorized as High, Medium and Low against Polity score categorized as autocracy, anocracy and democracy. We are looking at column percentages. Our initial results show that in Democracy column the female employment rate is significantly higher in the row labeled as ‘Medium’. The p Value 0.0003271499 is small enough to reject the NULL hypothesis. However we have more than one category for explanatory variable Polity score. We have 3 groups – autocracy, anocracy and democracy, hence the chi square and p value does not give us insight into why null hypothesis can be rejected. A post hoc test is required. Since there are 3 categories of the explanatory variable, we are going to make 3 comparisons. The Bonferroni adjusted p value 0.017 (0.5/3).Results of Post Hoc test
Since there are 3 categories of the explanatory variable, 3
comparisons are made.
Anocracy VS Autocracy: The Chi Square Test value is 1.685
and p Value is 0.43, which is greater than 0.017. Hence we cannot reject the
NULL hypothesis for this comparison.
Autocracy
VS Democracy: The Chi Square Test value is 10.64 and p Value is 0.004885. The p
Value here is less than 0.017 hence we can reject the NULL hypothesis and
accept the alternative hypothesis. This means compared to autocratic countries,
democratic countries have a higher female employment rate.
Anocracy VS Democracy: The Chi Square Test value is 17.52139 and p Value is 0.000157. The p Value here again is significantly less than 0.017 and hence we ca safely reject the NULL hypothesis.
Conclusion
Chi Square test shows that polity
score is in fact related to female employment rate. Democratic countries have a
significantly higher female employment rate than Anocratic countries.


No comments:
Post a Comment