The data set in question is Gapminder. I am looking at
relationship between urban population rate and internet usage. I am interested
in seeing if polity score of a country moderates the relationship between urban
rate and internet usage.
Code
# -*- coding: utf-8 -*-
"""
Created on Sun Nov 15 18:56:59 2015

@author: Abhishek
"""
import numpy
import pandas
import statsmodels.formula.api as smf
import statsmodels.stats.multicomp as multi
import seaborn
import matplotlib.pyplot as plt
import scipy.stats

data = pandas.read_csv('gapminder.csv', low_memory=False)
pandas.set_option('display.float_format', lambda x: '%f'%x)

data['urbanrate'] = pandas.to_numeric(data['urbanrate'],errors='coerce')
data['internetuserate'] = pandas.to_numeric(data['internetuserate'],errors='coerce')
data['polityscore'] = pandas.to_numeric(data['polityscore'], errors='coerce')

data['polity_cat'] = pandas.cut(data.polityscore, [-10, -6, 5, 10], labels=['autocracy', 'anocracy', 'democracy'])
data['urbanrate_cat'] = pandas.cut(data.urbanrate, [10,40,70,100], labels=['sparse', 'moderate','dense'])

data['polity_cat'] =data['polity_cat'].astype(numpy.object)
data['polity_cat'] = data['polity_cat'].replace(' ',numpy.nan)

data['urbanrate_cat'] =data['urbanrate_cat'].astype(numpy.object)
data['urbanrate_cat'] = data['urbanrate_cat'].replace(' ',numpy.nan)

data['internetuserate_cat'] = pandas.cut(data.internetuserate, 3, labels=['low', 'moderate','high'])
data['internetuserate_cat'] =data['internetuserate_cat'].astype(numpy.object)
data['internetuserate_cat'] = data['internetuserate_cat'].replace(' ',numpy.nan)

sub2=data[(data['polity_cat']=='autocracy')]
sub3=data[(data['polity_cat']=='anocracy')]
sub4=data[(data['polity_cat']=='democracy')]

#%%

# ANOVA

model1 = smf.ols(formula='internetuserate ~ C(urbanrate_cat)', data=data).fit()
print (model1.summary())

print("Means of Polity Scores")
sub1 = data[['internetuserate', 'urbanrate_cat']].dropna()
m1 = sub1.groupby('urbanrate_cat').mean()
print(m1)

print("Standard Deviation for mean Polity score")
st1 = sub1.groupby('urbanrate_cat').std()
print(st1)

# bivariate bar graph
seaborn.factorplot(x="urbanrate_cat", y="internetuserate", data=data, kind="bar", ci=None)
plt.xlabel('Urban Population Rate')
plt.ylabel('Internet Usage Rate')


#%%

print("==========================================================================")
print("==========================================================================")
print()
print()

print ('association between urbanrate and internet usage for autocratic countries')
model2 = smf.ols(formula='internetuserate ~ C(urbanrate_cat)', data=sub2).fit()
print (model2.summary())

print("Standard Deviation for mean Polity score")
st1 = sub1.groupby('urbanrate_cat').std()
print(st1)

# bivariate bar graph
seaborn.factorplot(x="urbanrate_cat", y="internetuserate", data=sub2, kind="bar", ci=None)
plt.xlabel('Urban Population Rate')
plt.ylabel('Internet Usage Rate')

print ('association between urbanrate and internet usage for anocratic countries')
model3 = smf.ols(formula='internetuserate ~ C(urbanrate_cat)', data=sub3).fit()
print (model3.summary())

# bivariate bar graph
seaborn.factorplot(x="urbanrate_cat", y="internetuserate", data=sub3, kind="bar", ci=None)
plt.xlabel('Urban Population Rate')
plt.ylabel('Internet Usage Rate')

print ('association between urbanrate and internet usage for democratic countries')
model3 = smf.ols(formula='internetuserate ~ C(urbanrate_cat)', data=sub4).fit()
print (model3.summary())

# bivariate bar graph
seaborn.factorplot(x="urbanrate_cat", y="internetuserate", data=sub4, kind="bar", ci=None)
plt.xlabel('Urban Population Rate')
plt.ylabel('Internet Usage Rate')

print("==========================================================================")
print("==========================================================================")


#%%

# Chi Sqaure Test of independence

print("Chi Square Test of Independence: Internet usage rate vs urban population rate")
print("-----------------------------------------------------------------------------")

ct=pandas.crosstab(data['internetuserate_cat'], data['urbanrate_cat'])

# column sum
colsum = ct.sum(axis=0)
colpct = ct/colsum
print(colpct*100)
print('--------------------------------------------------------------')

print('chi square value, p value, expected count')
cs = scipy.stats.chi2_contingency(ct)
print(cs)
print()

print("Chi Square Test of Independence: Test for moderation for Autocratic countries")
print("-----------------------------------------------------------------------------")

ct=pandas.crosstab(sub2['internetuserate_cat'], sub2['urbanrate_cat'])
#%%

# column sum
colsum = ct.sum(axis=0)
colpct = ct/colsum
print(colpct*100)
print('--------------------------------------------------------------')

print('chi square value, p value, expected count')
cs = scipy.stats.chi2_contingency(ct)
print(cs)
print()

print("Chi Square Test of Independence: Test for moderation for Anocratic countries")
print("-----------------------------------------------------------------------------")

ct=pandas.crosstab(sub3['internetuserate_cat'], sub3['urbanrate_cat'])
#%%

# column sum
colsum = ct.sum(axis=0)
colpct = ct/colsum
print(colpct*100)
print('--------------------------------------------------------------')

print('chi square value, p value, expected count')
cs = scipy.stats.chi2_contingency(ct)
print(cs)
print()

print("Chi Square Test of Independence: Test for moderation for Democratic countries")
print("-----------------------------------------------------------------------------")

ct=pandas.crosstab(sub4['internetuserate_cat'], sub4['urbanrate_cat'])
#%%

# column sum
colsum = ct.sum(axis=0)
colpct = ct/colsum
print(colpct*100)
print('--------------------------------------------------------------')

print('chi square value, p value, expected count')
cs = scipy.stats.chi2_contingency(ct)
print(cs)
print()

#%%


# Pearson Correlation

data['internetuserate'] = data['internetuserate'].replace(' ',numpy.nan)
data['urbanrate'] = data['urbanrate'].replace(' ',numpy.nan)
data['polityscore'] = data['polityscore'].replace(' ',numpy.nan)

data_clean=data.dropna()

print ('Pearson Correlation: urbanrate and internetusage')
print (scipy.stats.pearsonr(data_clean['urbanrate'], data_clean['internetuserate']))

def polityscoregrp (row):
   if row['polityscore'] <= -5:
      return 1
   elif row['polityscore'] <= 5 :
      return 2
   elif row['polityscore'] < 10:
      return 3

data_clean['polityscore_grp'] = data_clean.apply (lambda row: polityscoregrp (row),axis=1)

chk1 = data_clean['polityscore_grp'].value_counts(sort=False, dropna=False)
print(chk1)

sub2=data_clean[(data_clean['polityscore_grp']== 1)]
sub3=data_clean[(data_clean['polityscore_grp']== 2)]
sub4=data_clean[(data_clean['polityscore_grp']== 3)]

sub2_clean = sub2.dropna()
sub3_clean = sub3.dropna()
sub4_clean = sub4.dropna()

print('--------------------------------------------------')
print ('Test of moderation by polityscorePearson Correlation: urbanrate and internetusage ')
print (scipy.stats.pearsonr(sub2_clean['urbanrate'], sub2_clean['internetuserate']))
print (scipy.stats.pearsonr(sub3_clean['urbanrate'], sub3_clean['internetuserate']))
print (scipy.stats.pearsonr(sub4_clean['urbanrate'], sub4_clean['internetuserate']))

#%%
scat2 = seaborn.regplot(x="internetuserate", y="urbanrate", data=sub2_clean)
plt.xlabel('Internet Use Rate')
plt.ylabel('Urban Rate')
plt.title('Scatterplot for the Association Between Urban Rate and Internet Use Rate for Autocratic countries')
print (scat2)

#%%
scat3 = seaborn.regplot(x="internetuserate", y="urbanrate", data=sub3_clean)
plt.xlabel('Internet Use Rate')
plt.ylabel('Urban Rate')
plt.title('Scatterplot for the Association Between Urban Rate and Internet Use Rate for Anocratic countries')
print (scat3)

#%%
scat4 = seaborn.regplot(x="internetuserate", y="urbanrate", data=sub4_clean)
plt.xlabel('Internet Use Rate')
plt.ylabel('Urban Rate')
plt.title('Scatterplot for the Association Between Urban Rate and Internet Use Rate for Democratic countries')
print (scat4)
Results
ANOVA
To conduct ANOVA, the urbanrate variable has been
categorized into sparse, moderate and dense, signifying sparsely populated,
moderately populated and densely populated.
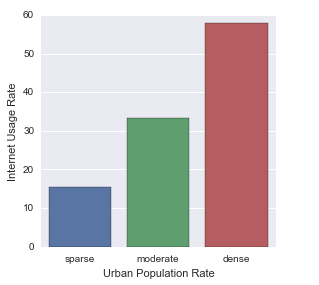
The large F-Statistic and very small p value show that the null hypothesis can be rejected in this case. There is a relationship between urban population rate and internet usage. The Means show that internet usage increases with population density. The bar graph reiterates the relationship between Internet Usage and Urban Population rate.
ANOVA Test of Moderation by Polity Score
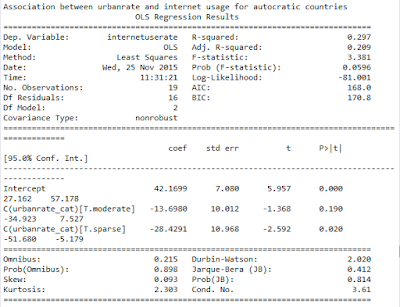
From the above ANOVA results we see that when polity score of a country is in between -5 and 5, that is the country is autocratic, the variable does moderate the relationship between urban population rate and internet usage.
Chi Square Test of Independence
For Chi Square Test of Independence the Internet Usage Rate is categorized in Low, Moderate and High. Chi Square Test is run on internet usage rate and categorical variable with low, moderate and high categories versus urban population rate with categories sparse, moderate and dense. The results are as follows
The test without introducing a moderating variable shows a large chi square value and very small p value as expected. Since null hypothesis can be rejected and assume that there is relationship between the two categories.
Chi Square Test of Moderation by Polity Score
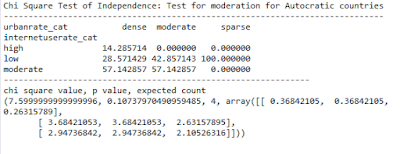
The Chi Square Test with polity score used as moderating variable shows that for autocratic countries the null hypothesis cannot be rejected. Hence the polity score moderates the result when it falls in autocratic range. These results are in keeping with Anova results.
Pearson Correlation
This test looks at the correlation between urban population rate and internet usage. The polity score which is the moderating variable, is grouped in three groups to ease the testing of moderation. The three groups are numbered 1, 2, 3. 1 being range of -10 to -5, 2 is range -5 to 5 and 3 is from 5 to 10. A country falling in range 3 is democratic.
The p value as shown above is quite small and hence we concur that there is a relationship between internet usage and urban population density. The cross tab function table shows the counts in each groups 1,2 and 3.
Correlation moderated by Polity Score
The results show for Autocratic countries that is countries that fall in the range 1 definitely moderate the correlation result of urban population rate and internet usage.
In conclusion, we can see that polity score does moderate the results of ANOVA, Chi Square Test of Independence and Correlation of urban population rate and internet usage when polity score is autocratic.


No comments:
Post a Comment