Wednesday, December 23, 2015

Test Logistic Regression Model

HYPOTHESIS

I am using the Gapminder data set. My Response variable is Polity Score. I am testing if political stand of a country has an association with Internet usage. Other explanatory variables considered are – female employment rate, percentage population in armed forces, life expectancy and employment rate of a country. The hypothesis is that a country tends to have an opinion, either autocratic or democratic, where internet use rate is more. Hence I am expecting a positive intercept

CODE

# -*- coding: utf-8 -*-
"""
Created on Tue Dec 22 12:38:05 2015

@author: Abhishek
"""

import numpy
import pandas
import statsmodels.api as sm
import seaborn
import statsmodels.formula.api as smf 

# bug fix for display formats to avoid run time errors
pandas.set_option('display.float_format', lambda x: '%f'%x)

data = pandas.read_csv('gapminder.csv', low_memory=False)

# Replace empty values with NaN
data['polityscore'] = data['polityscore'].astype(numpy.object)
data['polityscore'] = data['polityscore'].replace(' ',numpy.nan)
data['polityscore'] = data['polityscore'].replace('',numpy.nan)

data['femaleemployrate'] = data['femaleemployrate'].astype(numpy.object)
data['femaleemployrate'] = data['femaleemployrate'].replace(' ',numpy.nan)
data['femaleemployrate'] = data['femaleemployrate'].replace('',numpy.nan)

data['internetuserate'] = data['internetuserate'].astype(numpy.object)
data['internetuserate'] = data['internetuserate'].replace(' ',numpy.nan)
data['internetuserate'] = data['internetuserate'].replace('',numpy.nan)

data['armedforcesrate'] = data['armedforcesrate'].astype(numpy.object)
data['armedforcesrate'] = data['armedforcesrate'].replace(' ',numpy.nan)
data['armedforcesrate'] = data['armedforcesrate'].replace('',numpy.nan)

data['lifeexpectancy'] = data['lifeexpectancy'].astype(numpy.object)
data['lifeexpectancy'] = data['lifeexpectancy'].replace(' ',numpy.nan)
data['lifeexpectancy'] = data['lifeexpectancy'].replace('',numpy.nan)

data['employrate'] = data['employrate'].astype(numpy.object)
data['employrate'] = data['employrate'].replace(' ',numpy.nan)
data['employrate'] = data['employrate'].replace('',numpy.nan)

data['incomeperperson'] = data['incomeperperson'].astype(numpy.object)
data['incomeperperson'] = data['incomeperperson'].replace('',numpy.nan)
data['incomeperperson'] = data['incomeperperson'].replace(' ',numpy.nan)


# Response Variable
data['polityscore'] = pandas.to_numeric(data['polityscore'], errors='coerce')

# Explanatory Variables
data['incomeperperson'] = pandas.to_numeric(data['incomeperperson'], errors='coerce')
data['employrate'] = pandas.to_numeric(data['employrate'], errors='coerce')
data['femaleemployrate'] = pandas.to_numeric(data['femaleemployrate'], errors='coerce')
data['internetuserate'] = pandas.to_numeric(data['internetuserate'], errors='coerce')
data['armedforcesrate'] = pandas.to_numeric(data['armedforcesrate'], errors='coerce')
data['lifeexpectancy'] = pandas.to_numeric(data['lifeexpectancy'], errors='coerce')

sub1 = data.copy()

#%%
# Data Management: Polity Score is chosen as the response variable. 
# -10 to -5: Autocratic, -5 to 5: Anocratic and 5 to 10: Democratic
# Here, Anocratic countries are coded as 0 and countries with political 
# biases are coded as 1. Hence we have out bivariate response variable

def RecodePolityScore (row):
   if row['polityscore']<=-5 or row['polityscore']>=5 :
      return 1
   elif row['polityscore']>-5 and row['polityscore']<5 data-blogger-escaped-0="" data-blogger-escaped-:="" data-blogger-escaped-and="" data-blogger-escaped-def="" data-blogger-escaped-elif="" data-blogger-escaped-femaleemployrate="" data-blogger-escaped-if="" data-blogger-escaped-numpy.nan="" data-blogger-escaped-recodefemaleemprate="" data-blogger-escaped-return="" data-blogger-escaped-row="">=65 and row['femaleemployrate'] != numpy.nan :
      return 1

def RecodeInternetUseRate (row):
   if row['internetuserate']<=10 and row['internetuserate'] != numpy.nan:
      return 0
   elif row['internetuserate']>=65 and row['internetuserate'] != numpy.nan:
      return 1

def RecodeArmedForcesRate (row):
   if row['armedforcesrate']<=1 and row['armedforcesrate'] != numpy.nan:
      return 0
   elif row['armedforcesrate']>=5 and row['armedforcesrate'] != numpy.nan:
      return 1

def RecodeLifeExpectancyRate (row):
   if row['lifeexpectancy']<=55 and row['lifeexpectancy'] != numpy.nan :
      return 0
   elif row['lifeexpectancy']>=80 and row['lifeexpectancy'] != numpy.nan :
      return 1

def RecodeEmploymentRate (row):
   if row['employrate']<=45 and row['employrate'] != numpy.nan :
      return 0
   elif row['employrate']>=75 and row['employrate'] != numpy.nan :
      return 1

def RecodeIncomePerPerson (row):
   if row['incomeperperson']<=250 and row['incomeperperson'] != numpy.nan :
      return 0
   elif row['incomeperperson']>=10000 and row['incomeperperson'] != numpy.nan :
      return 1

# Check that recoding is done      
sub1['polityscore'] = sub1.apply(lambda row: RecodePolityScore(row),axis=1)
chk1d = sub1['polityscore'].value_counts(sort=False, dropna=True)
print (chk1d)

sub1['femaleemployrate'] = sub1.apply(lambda row: RecodeFemaleEmpRate(row),axis=1)
chk1d = sub1['femaleemployrate'].value_counts(sort=False, dropna=True)
print (chk1d)

sub1['internetuserate'] = sub1.apply(lambda row: RecodeInternetUseRate(row),axis=1)
chk1d = sub1['internetuserate'].value_counts(sort=False, dropna=True)
print (chk1d)

sub1['armedforcesrate'] = sub1.apply(lambda row: RecodeArmedForcesRate(row),axis=1)
chk1d = sub1['armedforcesrate'].value_counts(sort=False, dropna=True)
print (chk1d)

sub1['lifeexpectancy'] = sub1.apply(lambda row: RecodeLifeExpectancyRate(row),axis=1)
chk1d = sub1['lifeexpectancy'].value_counts(sort=False, dropna=True)
print (chk1d)

sub1['employrate'] = sub1.apply(lambda row: RecodeEmploymentRate(row),axis=1)
chk1d = sub1['employrate'].value_counts(sort=False, dropna=True)
print (chk1d)

sub1['incomeperperson'] = sub1.apply(lambda row: RecodeIncomePerPerson(row),axis=1)
chk1d = sub1['incomeperperson'].value_counts(sort=False, dropna=True)
print (chk1d)


#%%
# Logistic Regression

lreg1 = smf.logit(formula = 'polityscore ~ internetuserate', data = sub1).fit()
print(lreg1.summary())
print()

# Odds Ratio
print("Odds Ratio")
print("----------")
print(numpy.exp(lreg1.params))
print()

# Confidence Interval
print("Confidence Interval")
print("-------------------")
params = lreg1.params
conf = lreg1.conf_int()
conf['OR'] = params
conf.columns = ['Lower CI', 'Upper CI', 'OR']
print(numpy.exp(conf))

#%%
# Logistic Regression - femaleemployrate as explanatory variable

lreg2 = smf.logit(formula = 'polityscore ~ femaleemployrate', data = sub1).fit()
print(lreg2.summary())
print()

# Odds Ratio
print("Odds Ratio")
print("----------")
print(numpy.exp(lreg2.params))
print()

# Confidence Interval
print("Confidence Interval")
print("-------------------")
params = lreg2.params
conf = lreg2.conf_int()
conf['OR'] = params
conf.columns = ['Lower CI', 'Upper CI', 'OR']
print(numpy.exp(conf))

#%%
# Logistic Regression - armedforcesrate as explanatory variable

lreg3 = smf.logit(formula = 'polityscore ~ armedforcesrate', data = sub1).fit()
print(lreg3.summary())
print()

# Odds Ratio
print("Odds Ratio")
print("----------")
print(numpy.exp(lreg3.params))
print()

# Confidence Interval
print("Confidence Interval")
print("-------------------")
params = lreg3.params
conf = lreg3.conf_int()
conf['OR'] = params
conf.columns = ['Lower CI', 'Upper CI', 'OR']
print(numpy.exp(conf))

#%%
# Logistic Regression - lifeexpectancy as explanatory variable

lreg4 = smf.logit(formula = 'polityscore ~ lifeexpectancy', data = sub1).fit()
print(lreg4.summary())
print()

# Odds Ratio
print("Odds Ratio")
print("----------")
print(numpy.exp(lreg4.params))
print()

# Confidence Interval
print("Confidence Interval")
print("-------------------")
params = lreg4.params
conf = lreg4.conf_int()
conf['OR'] = params
conf.columns = ['Lower CI', 'Upper CI', 'OR']
print(numpy.exp(conf))

#%%
# Logistic Regression - employrate as explanatory variable

lreg3 = smf.logit(formula = 'polityscore ~ employrate', data = sub1).fit()
print(lreg3.summary())
print()

# Odds Ratio
print("Odds Ratio")
print("----------")
print(numpy.exp(lreg3.params))
print()

# Confidence Interval
print("Confidence Interval")
print("-------------------")
params = lreg3.params
conf = lreg3.conf_int()
conf['OR'] = params
conf.columns = ['Lower CI', 'Upper CI', 'OR']
print(numpy.exp(conf))

#%%
# Logistic Regression - incomeperperson as explanatory variable

lreg3 = smf.logit(formula = 'polityscore ~ incomeperperson', data = sub1).fit()
print(lreg3.summary())
print()

# Odds Ratio
print("Odds Ratio")
print("----------")
print(numpy.exp(lreg3.params))
print()

# Confidence Interval
print("Confidence Interval")
print("-------------------")
params = lreg3.params
conf = lreg3.conf_int()
conf['OR'] = params
conf.columns = ['Lower CI', 'Upper CI', 'OR']
print(numpy.exp(conf))

#%%
# Test of Confounding -  internetuserate + lifeexpectancy

lreg3 = smf.logit(formula = 'polityscore ~ lifeexpectancy + internetuserate', data = sub1).fit()
print(lreg3.summary())
print()

# Odds Ratio
print("Odds Ratio")
print("----------")
print(numpy.exp(lreg3.params))
print()

# Confidence Interval
print("Confidence Interval")
print("-------------------")
params = lreg3.params
conf = lreg3.conf_int()
conf['OR'] = params
conf.columns = ['Lower CI', 'Upper CI', 'OR']
print(numpy.exp(conf))


DATA MANAGEMENT

I am using the Gapminder data set where all fields are continuous quantitative. I had to bin the response and explanatory variable into 0 and 1.

  • Since I am interested in whether a country is autocratic or democratic, polity score of a country has been re-coded as 1 if score falls between -10 to -5 and 5 to 10. Anocratic countries are neutral and their score falls between -5 to 5. They are recoded as 0
  • For all explanatory variables, the 2 bins are some percentage of lowest and highest quartile.


  • I have taken the liberty of assigning 0 and I appropriately looking at the span of values for each explanatory variable. More research into the context, that is how data was collected and what makes sense socially need to be looked into, to correctly bin the values of the explanatory variables

LOGISTIC REGRESSION


Explanatory Variable: Internet Use Rate

P Value: The parameter estimates from the table above shows that the regression is significant with p value 0.005. A linear equation will not make sense here so we move on to generating odds ratio

Odds Ratio: I can interpret the odds ratio results as, countries with high internet use rate or greater than 65% are 19.7 times more likely have a political stand (autocratic or democratic) than countries with less internet use rate or less than 10%

Confidence Interval: I can interpret the confidence interval as, there is a 95% certainty that the true population odds ratio falls between 2.46 and 157.6


Regression Analysis for all other explanatory variables


From the above results we see that income per person or GDP per capita and life expectancy are the only 2 variables who have a significant regression against polity score.

For Explanatory Variable: Income Per Person / GDP per capita

P Value: A p value of 0.012 indicates that the regression is significant.

Odds Ratio: An odds ratio of 20.67 can be interpreted as countries with GDP per capita greater than 10K USD are 20.67 times more likely have a political stand (autocratic or democratic) than countries with with low GDP, that is below 200 USD

Confidence Interval:  The confidence interval can be interpreted as, there is a 95% certainty that the true population odds ratio falls between 2 to 218.7 


For Explanatory Variable: Life Expectancy

P Value: A p value of 0.012 indicates that the regression is significant.

Odds Ratio: An odds ratio of 20.67 can be interpreted as countries with GDP per capita greater than 10K USD are 20.67 times more likely have a political stand (autocratic or democratic) than countries with with low GDP, that is below 200 USD


Confidence Interval:  The confidence interval can be interpreted as, there is a 95% certainty that the true population odds ratio falls between 2 to 218.7


Test for Confounding

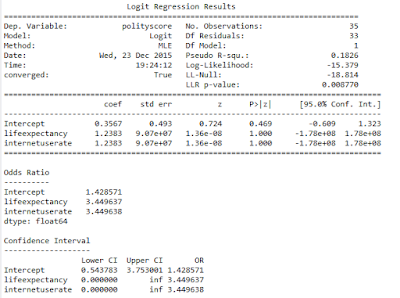
A logistic regression was run Internet Use Rate as explanatory variable with controlled variable Life expectancy.

The parameter values shows neither Internet Use rate nor Life expectancy is significant after controlling each in the logistic regression. In fact the relationship is non existent.

Sunday, December 20, 2015

Test Multiple Regression

I am using Gapminder data set. My hypothesis is Life Expectancy is associated with Urban population rate in a positive way. Life expectancy is the response variable and Urban Population rate is the explanatory variable. I will be testing if any confounding exists with variables – income per person, employment rate, co2 emission and alcohol consumption

Code


# -*- coding: utf-8 -*-
"""
Created on Sat Dec 12 14:11:38 2015

@author: Abhishek
"""

import numpy
import pandas
import matplotlib.pyplot as plt
import statsmodels.api as sm
import statsmodels.formula.api as smf
import seaborn

# bug fix for display formats to avoid run time errors
pandas.set_option('display.float_format', lambda x:'%.2f'%x)

data = pandas.read_csv('gapminder.csv')

# convert to numeric format

# Response Variable
data['lifeexpectancy'] = pandas.to_numeric(data['lifeexpectancy'], errors='coerce')

# Explanatory Variables
data['urbanrate'] = pandas.to_numeric(data['urbanrate'], errors='coerce')
data['incomeperperson'] = pandas.to_numeric(data['incomeperperson'], errors='coerce')
data['employrate'] = pandas.to_numeric(data['employrate'], errors='coerce')
data['co2emissions'] = pandas.to_numeric(data['co2emissions'], errors='coerce')
data['alcconsumption'] = pandas.to_numeric(data['alcconsumption'], errors='coerce')

# listwise deletion of missing values
sub1 = data[['lifeexpectancy', 'urbanrate','incomeperperson','employrate','co2emissions','alcconsumption']].dropna()

# first order (linear) scatterplot
scat1 = seaborn.regplot(x="urbanrate", y="lifeexpectancy", scatter=True, data=sub1)
plt.xlabel('Urban Population Rate')
plt.ylabel('Life Expectancy')

# fit second order polynomial
# run the 2 scatterplots together to get both linear and second order fit lines
scat1 = seaborn.regplot(x="urbanrate", y="lifeexpectancy", scatter=True, order=2, data=sub1)
plt.xlabel('Urban Population Rate')
plt.ylabel('Life Expectancy')

# center quantitative IVs for regression analysis
sub1['urbanrate_c'] = (sub1['urbanrate'] - sub1['urbanrate'].mean())
sub1['incomeperperson_c'] = (sub1['incomeperperson'] - sub1['incomeperperson'].mean())
sub1['employrate_c'] = (sub1['employrate'] - sub1['employrate'].mean())
sub1['co2emissions_c'] = (sub1['co2emissions'] - sub1['co2emissions'].mean())
sub1['alcconsumption_c'] = (sub1['alcconsumption'] - sub1['alcconsumption'].mean())

# linear regression analysis
reg1 = smf.ols('lifeexpectancy ~ urbanrate_c', data=sub1).fit()
print (reg1.summary())

reg2 = smf.ols('lifeexpectancy ~ urbanrate_c  + incomeperperson_c + employrate_c + co2emissions_c + alcconsumption_c ', data=sub1).fit()
print (reg2.summary())

reg3 = smf.ols('lifeexpectancy ~ urbanrate_c + I(urbanrate_c**2) + employrate_c', data=sub1).fit()
print (reg3.summary())

#Q-Q plot for normality
fig4=sm.qqplot(reg1.resid, line='r')


# simple plot of residuals
stdres=pandas.DataFrame(reg1.resid_pearson)
plt.plot(stdres, 'o', ls='None')
l = plt.axhline(y=0, color='r')
plt.ylabel('Standardized Residual')
plt.xlabel('Observation Number')


# additional regression diagnostic plots
fig2 = plt.figure(figsize(10,5))
fig2 = sm.graphics.plot_regress_exog(reg3,  "employrate_c", fig=fig2)

# leverage plot
fig3=sm.graphics.influence_plot(reg3, size=8)
print(fig3)

Results


From the p value and coefficient it seems like there is strong linear relationship between life expectancy and urban population rate. A quadratic or higher order variable is not required in the regression test. The code above does show the second variable added to the OLS regression function for academic purpose only. Further test with other explanatory variable are conducted to test for confounding.


 R squared value: We did not find any confounding variables but controlling other variables in the OLS regression does increase the R square value. Which means, with more variables in the mix the variability in association between Life Expectancy and Urban Population rate is less

The q-q plot somewhat follows a straight line but deviates considerably at lower and higher quantiles. There could be other explanatory variables that might strengthen the association between life expectancy and urban population rate.
Most of the residuals in the above graph fall between one standard deviation of the mean, between -1 and 1. Visually we can ascertain that about 95% of the residuals falls between 2 standard deviation of the mean. Since there are residual values beyond 2 standard deviation of mean on either side, it is warning that there are outliers and model is not a great fit.


Sunday, December 6, 2015

Test a Basic Linear Regression Model

I am testing the basic linear regression between Life Expectancy and Urban population rate. Data set used is Gapminder.

Code


# -*- coding: utf-8 -*-
"""
Created on Sun Dec  6 17:52:02 2015

@author: Abhishek
"""
import pandas
import statsmodels.formula.api as smf 
import seaborn
import matplotlib.pyplot as plt

# bug fix for display formats to avoid run time errors
pandas.set_option('display.float_format', lambda x:'%.2f'%x)

#call in data set
data = pandas.read_csv('gapminder.csv')

# convert variables to numeric format using convert_objects function
data['lifeexpectancy'] = pandas.to_numeric(data['lifeexpectancy'],errors='coerce')
data['urbanrate'] = pandas.to_numeric(data['urbanrate'],errors='coerce')

scat1 = seaborn.regplot(x="urbanrate", y="lifeexpectancy", scatter=True, data=data)
plt.ylabel('Life Expectancy')
plt.xlabel('Urbanization Rate')
plt.title ('Scatterplot for the Association Between Urban Rate and Life Expectancy')
print(scat1)

print ("OLS regression model for the association between urban rate and life expectancy")
# Quantitative Response Variable ~ Quantitative Explanatory Variable
reg1 = smf.ols('lifeexpectancy ~ urbanrate', data=data).fit()
print (reg1.summary())


Results


From above results - 

Dep Variable: Lifeexpectancy. This is the response variable. 
No. Observations: 188. Number of observations included in the analysis
F-statistic is 115.4 and p value is significantly smaller than alpha. This shows that we can safely reject null hypothesis.

Looking at the parameter estimates we can construct the life of best fir as follows - 

lifeexpectancy = 55.1732 + 0.2579 * urbanrate

P value from the P > |t| column can be reported as p < 0.0001. The values is very small, it is the value that would be obtained from Pearson Correlation Coefficient.

R-sqaured value: 0.38, accounts for 38% variability of response variable lifeexpectancy.

Sunday, November 29, 2015

About my Data

Sample

Data set used so far in my previous courses (Data Management and Visualization and Data Analysis Tools) is Gapminder. Since its conception in 2005, Gapminder has grown to include over 200 indicators, including gross domestic product, total employment rate, and estimated HIV prevalence. Gapminder contains data for all 192 UN members, aggregating data for Serbia and Montenegro. Additionally, it includes data for 24 other areas, generating a total of 215 areas. GapMinder collects data from a handful of sources, including the Institute for Health Metrics and Evaluation, US Census Bureau’s International Database, United Nations Statistics Division, and the World Bank.


Procedures

The variables that I have used from this data set so far are – female employment rate, polity score, income per person, urban population rate, internet usage rate. For several assignments I have selected data for above indicators for just the G20 countries

  • Female Employment Rate
    • Percentage of female population, age above that has been employed during the given year.
    • Source: International Labor Organization
    • Observational
    • Complete reference link
  • Polity Score:
    • Democracy score (based on Polity IV)
    • Source: Polity IV Project: Political Regime Characteristics and Transitions, 1800-2009. Overall polity score from the Polity IV dataset
    • Observational
    • Complete reference Link
  • Income per Person:
    • Gross Domestic Product per capita by Purchasing Power Parities (in international dollars, fixed 2011 prices). The inflation and differences in the cost of living between countries has been taken into account
    • Sources: Cross-country data for 2011 is mainly based on the 2011 round of the International Comparison Program. Estimates based on other sources were used for the other countries. Real growth rates were linked to the 2011 levels. Several sources are used for these growth rates, such as the data of Angus Maddison. Follow the link below to download the detailed documentation.
    • Experimental 
    • Complete reference link
  • Urban Population Rate:
    • Urban population refers to people living in urban areas as defined by national statistical offices. It is calculated using World Bank population estimates and urban ratios from the United Nations World Urbanization Prospects. Source: World Bank Staff estimates based on United Nations, World Urbanization Prospects.
    • Source: World Bank
    • Observational
    • Complete reference link
  • Internet Use Rate
    • Internet users are people with access to the worldwide network (per 100 people)
    • Source: World Bank
    • Complete reference link

Measures

  • Female Employment Rate: 2007 female employees age 15+ (% of population) Percentage of female population, age above 15, that has been employed during the given year
  • Polity Score: 2009 Democracy score (Polity) Overall polity score from the Polity IV dataset, calculated by subtracting an autocracy score from a democracy score. The summary measure of a country's democratic and free nature. -10 is the lowest value, 10 the highest
  • Income per Person:  2010 Gross Domestic Product per capita in constant 2000 US$. The inflation but not the differences in the cost of living between countries has been taken into account
  • Urban Population: 2008 urban population (% of total) Urban population refers to people living in urban areas as defined by national statistical offices (calculated using World Bank population estimates and urban ratios from the United Nations World Urbanization Prospects)
  • Internet Use Rate: 2010 Internet users (per 100 people) Internet users are people with access to the worldwide network.


References

Wednesday, November 25, 2015

Exploring Statistical Interactions

The data set in question is Gapminder. I am looking at relationship between urban population rate and internet usage. I am interested in seeing if polity score of a country moderates the relationship between urban rate and internet usage.

Code


# -*- coding: utf-8 -*- """ Created on Sun Nov 15 18:56:59 2015 @author: Abhishek """ import numpy import pandas import statsmodels.formula.api as smf import statsmodels.stats.multicomp as multi import seaborn import matplotlib.pyplot as plt import scipy.stats data = pandas.read_csv('gapminder.csv', low_memory=False) pandas.set_option('display.float_format', lambda x: '%f'%x) data['urbanrate'] = pandas.to_numeric(data['urbanrate'],errors='coerce') data['internetuserate'] = pandas.to_numeric(data['internetuserate'],errors='coerce') data['polityscore'] = pandas.to_numeric(data['polityscore'], errors='coerce') data['polity_cat'] = pandas.cut(data.polityscore, [-10, -6, 5, 10], labels=['autocracy', 'anocracy', 'democracy']) data['urbanrate_cat'] = pandas.cut(data.urbanrate, [10,40,70,100], labels=['sparse', 'moderate','dense']) data['polity_cat'] =data['polity_cat'].astype(numpy.object) data['polity_cat'] = data['polity_cat'].replace(' ',numpy.nan) data['urbanrate_cat'] =data['urbanrate_cat'].astype(numpy.object) data['urbanrate_cat'] = data['urbanrate_cat'].replace(' ',numpy.nan) data['internetuserate_cat'] = pandas.cut(data.internetuserate, 3, labels=['low', 'moderate','high']) data['internetuserate_cat'] =data['internetuserate_cat'].astype(numpy.object) data['internetuserate_cat'] = data['internetuserate_cat'].replace(' ',numpy.nan) sub2=data[(data['polity_cat']=='autocracy')] sub3=data[(data['polity_cat']=='anocracy')] sub4=data[(data['polity_cat']=='democracy')] #%% # ANOVA model1 = smf.ols(formula='internetuserate ~ C(urbanrate_cat)', data=data).fit() print (model1.summary()) print("Means of Polity Scores") sub1 = data[['internetuserate', 'urbanrate_cat']].dropna() m1 = sub1.groupby('urbanrate_cat').mean() print(m1) print("Standard Deviation for mean Polity score") st1 = sub1.groupby('urbanrate_cat').std() print(st1) # bivariate bar graph seaborn.factorplot(x="urbanrate_cat", y="internetuserate", data=data, kind="bar", ci=None) plt.xlabel('Urban Population Rate') plt.ylabel('Internet Usage Rate') #%% print("==========================================================================") print("==========================================================================") print() print() print ('association between urbanrate and internet usage for autocratic countries') model2 = smf.ols(formula='internetuserate ~ C(urbanrate_cat)', data=sub2).fit() print (model2.summary()) print("Standard Deviation for mean Polity score") st1 = sub1.groupby('urbanrate_cat').std() print(st1) # bivariate bar graph seaborn.factorplot(x="urbanrate_cat", y="internetuserate", data=sub2, kind="bar", ci=None) plt.xlabel('Urban Population Rate') plt.ylabel('Internet Usage Rate') print ('association between urbanrate and internet usage for anocratic countries') model3 = smf.ols(formula='internetuserate ~ C(urbanrate_cat)', data=sub3).fit() print (model3.summary()) # bivariate bar graph seaborn.factorplot(x="urbanrate_cat", y="internetuserate", data=sub3, kind="bar", ci=None) plt.xlabel('Urban Population Rate') plt.ylabel('Internet Usage Rate') print ('association between urbanrate and internet usage for democratic countries') model3 = smf.ols(formula='internetuserate ~ C(urbanrate_cat)', data=sub4).fit() print (model3.summary()) # bivariate bar graph seaborn.factorplot(x="urbanrate_cat", y="internetuserate", data=sub4, kind="bar", ci=None) plt.xlabel('Urban Population Rate') plt.ylabel('Internet Usage Rate') print("==========================================================================") print("==========================================================================") #%% # Chi Sqaure Test of independence print("Chi Square Test of Independence: Internet usage rate vs urban population rate") print("-----------------------------------------------------------------------------") ct=pandas.crosstab(data['internetuserate_cat'], data['urbanrate_cat']) # column sum colsum = ct.sum(axis=0) colpct = ct/colsum print(colpct*100) print('--------------------------------------------------------------') print('chi square value, p value, expected count') cs = scipy.stats.chi2_contingency(ct) print(cs) print() print("Chi Square Test of Independence: Test for moderation for Autocratic countries") print("-----------------------------------------------------------------------------") ct=pandas.crosstab(sub2['internetuserate_cat'], sub2['urbanrate_cat']) #%% # column sum colsum = ct.sum(axis=0) colpct = ct/colsum print(colpct*100) print('--------------------------------------------------------------') print('chi square value, p value, expected count') cs = scipy.stats.chi2_contingency(ct) print(cs) print() print("Chi Square Test of Independence: Test for moderation for Anocratic countries") print("-----------------------------------------------------------------------------") ct=pandas.crosstab(sub3['internetuserate_cat'], sub3['urbanrate_cat']) #%% # column sum colsum = ct.sum(axis=0) colpct = ct/colsum print(colpct*100) print('--------------------------------------------------------------') print('chi square value, p value, expected count') cs = scipy.stats.chi2_contingency(ct) print(cs) print() print("Chi Square Test of Independence: Test for moderation for Democratic countries") print("-----------------------------------------------------------------------------") ct=pandas.crosstab(sub4['internetuserate_cat'], sub4['urbanrate_cat']) #%% # column sum colsum = ct.sum(axis=0) colpct = ct/colsum print(colpct*100) print('--------------------------------------------------------------') print('chi square value, p value, expected count') cs = scipy.stats.chi2_contingency(ct) print(cs) print() #%% # Pearson Correlation data['internetuserate'] = data['internetuserate'].replace(' ',numpy.nan) data['urbanrate'] = data['urbanrate'].replace(' ',numpy.nan) data['polityscore'] = data['polityscore'].replace(' ',numpy.nan) data_clean=data.dropna() print ('Pearson Correlation: urbanrate and internetusage') print (scipy.stats.pearsonr(data_clean['urbanrate'], data_clean['internetuserate'])) def polityscoregrp (row): if row['polityscore'] <= -5: return 1 elif row['polityscore'] <= 5 : return 2 elif row['polityscore'] < 10: return 3 data_clean['polityscore_grp'] = data_clean.apply (lambda row: polityscoregrp (row),axis=1) chk1 = data_clean['polityscore_grp'].value_counts(sort=False, dropna=False) print(chk1) sub2=data_clean[(data_clean['polityscore_grp']== 1)] sub3=data_clean[(data_clean['polityscore_grp']== 2)] sub4=data_clean[(data_clean['polityscore_grp']== 3)] sub2_clean = sub2.dropna() sub3_clean = sub3.dropna() sub4_clean = sub4.dropna() print('--------------------------------------------------') print ('Test of moderation by polityscorePearson Correlation: urbanrate and internetusage ') print (scipy.stats.pearsonr(sub2_clean['urbanrate'], sub2_clean['internetuserate'])) print (scipy.stats.pearsonr(sub3_clean['urbanrate'], sub3_clean['internetuserate'])) print (scipy.stats.pearsonr(sub4_clean['urbanrate'], sub4_clean['internetuserate'])) #%% scat2 = seaborn.regplot(x="internetuserate", y="urbanrate", data=sub2_clean) plt.xlabel('Internet Use Rate') plt.ylabel('Urban Rate') plt.title('Scatterplot for the Association Between Urban Rate and Internet Use Rate for Autocratic countries') print (scat2) #%% scat3 = seaborn.regplot(x="internetuserate", y="urbanrate", data=sub3_clean) plt.xlabel('Internet Use Rate') plt.ylabel('Urban Rate') plt.title('Scatterplot for the Association Between Urban Rate and Internet Use Rate for Anocratic countries') print (scat3) #%% scat4 = seaborn.regplot(x="internetuserate", y="urbanrate", data=sub4_clean) plt.xlabel('Internet Use Rate') plt.ylabel('Urban Rate') plt.title('Scatterplot for the Association Between Urban Rate and Internet Use Rate for Democratic countries') print (scat4)

Results

ANOVA

To conduct ANOVA, the urbanrate variable has been categorized into sparse, moderate and dense, signifying sparsely populated, moderately populated and densely populated.


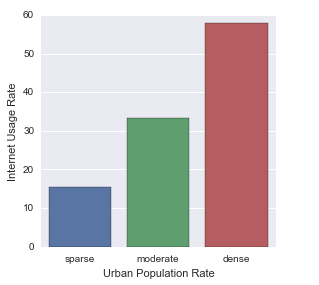
The large F-Statistic and very small p value show that the null hypothesis can be rejected in this case. There is a relationship between urban population rate and internet usage. The Means show that  internet usage increases with population density. The bar graph reiterates the relationship between Internet Usage and Urban Population rate.

ANOVA Test of Moderation by Polity Score


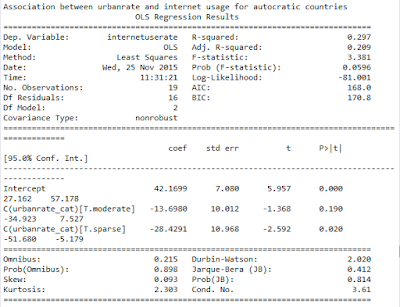
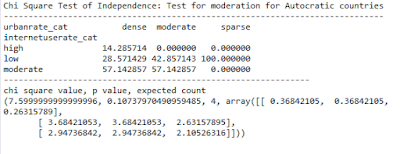
From the above ANOVA results we see that when polity score of a country is in between -5 and 5, that is the country is autocratic, the variable does moderate the relationship between urban population rate and internet usage. 

Chi Square Test of Independence

For Chi Square Test of Independence the Internet Usage Rate is categorized in Low, Moderate and High. Chi Square Test is run on internet usage rate and categorical variable with low, moderate and high categories versus urban population rate with categories sparse, moderate and dense. The results are as follows


The test without introducing a moderating variable shows a large chi square value and very small p value as expected. Since null hypothesis can be rejected and assume that there is relationship between the two categories.

Chi Square Test of Moderation by Polity Score


The Chi Square Test with polity score used as moderating variable shows that for autocratic countries the null hypothesis cannot be rejected. Hence the polity score moderates the result when it falls in autocratic range. These results are in keeping with Anova results.

Pearson Correlation

This test looks at the correlation between urban population rate and internet usage. The polity score which is the moderating variable, is grouped in three groups to ease the testing of moderation. The three groups are numbered 1, 2, 3. 1 being range of -10 to -5, 2 is range -5 to 5 and 3 is from 5 to 10. A country falling in range 3 is democratic.

The p value as shown above is quite small and hence we concur that there is a relationship between internet usage and urban population density. The cross tab function table shows the counts in each groups 1,2 and 3.

Correlation moderated by Polity Score

The results show for Autocratic countries that is countries that fall in the range 1 definitely moderate the correlation result of urban population rate and internet usage.


In conclusion, we can see that polity score does moderate the results of ANOVA, Chi Square Test of Independence and Correlation of urban population rate and internet usage when polity score is autocratic.

Saturday, November 14, 2015

Calculating Correlation

I have been using the Gapminder data set for my research questions. Unlike my previous submissions, where I have been looking at female employment rate, here I am looking at correlation between life expectancy vs urban rate.

Code


# -*- coding: utf-8 -*- """ Created on Thu Nov 12 14:06:59 2015 @author: Abhishek """ import pandas import numpy import seaborn import scipy import matplotlib.pyplot as plt data = pandas.read_csv('gapminder.csv', low_memory=False) pandas.set_option('display.float_format', lambda x: '%f'%x) data['lifeexpectancy'] = data['lifeexpectancy'].convert_objects(convert_numeric=True) data['urbanrate'] = data['urbanrate'].convert_objects(convert_numeric=True) ''' scat1 = seaborn.regplot(x='urbanrate', y='lifeexpectancy', fit_reg=True,data=data) plt.xlabel('Urban Rate') plt.ylabel('Life Expentancy') plt.title('Scatterplot Urban Rate VS Life Expectancy') ''' data['lifeexpectancy'] = data['lifeexpectancy'].replace(' ',numpy.nan) data['urbanrate'] = data['urbanrate'].replace(' ',numpy.nan) data_clean=data.dropna() print ('association between urbanrate and lifeexpectancy') print (scipy.stats.pearsonr(data_clean['urbanrate'], data_clean['lifeexpectancy']))

Results


The p Value is significant and correlation coefficient is 0.61870


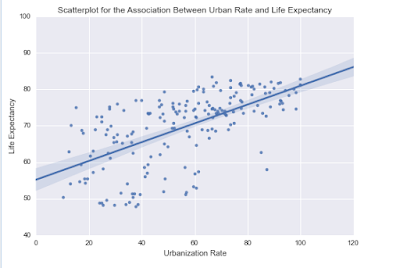
The scatter plot above shows that there is a positive linear relationship between lifeexpectance and urbanrate. As shown by the correlation number, the relationship is of modest strength.

The relationship is statistically significant. It is likely that countries with higher urban population have higher life expectancy.

Squaring r, give us 0.38. This means that if we know the x variable in scatter plot, in this case urbanrate, then we can predict 38% of life expectancy. 62% is unaccounted for.

Thursday, November 12, 2015

Chi Square Test of Independence

In case of Chi Square test of independence I will use the same research question as last post, which is if female employment rate is associated with polity score of a country. The NULL hypothesis being: there is no association between female employment rate and polity score. In the GAPMINDER data set both these fields are numeric. In order to do a Chi Square test I had to categorize these fields.

Polity Score Categories -
Autocracies: -10 to -6
Anocracies: -5 to 5
Democracies: 6 to 10
The categories are obtained from the definition of Polity score in Wikipedia.

Code


# -*- coding: utf-8 -*-
"""
Created on Sun Nov  8 13:54:31 2015

@author: Abhishek
"""
import pandas
import scipy.stats
import seaborn
import matplotlib.pyplot as plt

data = pandas.read_csv('gapminder.csv', low_memory=False)
pandas.set_option('display.float_format', lambda x: '%f'%x)

data['femaleemployrate'] = data['femaleemployrate'].convert_objects(convert_numeric=True)
data['polityscore'] = data['polityscore'].convert_objects(convert_numeric=True)

data['polityscore'] = pandas.to_numeric(data['polityscore'], errors='coerce')
data['polity_cat'] = pandas.cut(data.polityscore, [-10, -6, 5, 10], labels=['autocracy', 'anocracy', 'democracy'])

data['femaleemployrate'] = pandas.to_numeric(data['femaleemployrate'], errors='coerce')
data['femaleemployrate_cat'] = pandas.cut(data.femaleemployrate, [0, 25, 75, 100], labels=['low', 'medium', 'high'])

ct=pandas.crosstab(data['femaleemployrate_cat'], data['polity_cat'])
print(ct)
print('--------------------------------------------------------------')

# column sum
colsum = ct.sum(axis=0)
colpct = ct/colsum
print(colpct*100)
print('--------------------------------------------------------------')

# Chi Square
print('chi square value, p value, expected count')
cs = scipy.stats.chi2_contingency(ct)
print(cs)

data["polity_cat"] =data["polity_cat"].astype('category')
data["femaleemployrate_cat"] = data["femaleemployrate_cat"].convert_objects(convert_numeric=True)

plt.xlabel('Polity Score')
plt.ylabel('Female Employment Rate')
seaborn.factorplot(x="polity_cat",y="femaleemployrate",data=data,kind="bar",ci=None)

print()
print()

# Post Hoc Test
print('---------------------------------------------------------------')
print('                      Post Hoc Test                            ')
print('---------------------------------------------------------------')

recode = {'autocracy': 'autocracy', 'anocracy': 'anocracy' }
data['comp1'] = data['polity_cat'].map(recode)
ct = pandas.crosstab(data['femaleemployrate_cat'], data['comp1'])
print(ct)
print('--------------------------------------------------------------')
colsum = ct.sum(axis=0)
colpct = ct/colsum
print(colpct*100)
print('--------------------------------------------------------------')

print('chi square value, p value, expected count')
cs = scipy.stats.chi2_contingency(ct)
print(cs)
print('--------------------------------------------------------------')

recode = {'autocracy': 'autocracy', 'democracy':'democracy' }
data['comp2'] = data['polity_cat'].map(recode)
ct = pandas.crosstab(data['femaleemployrate_cat'], data['comp2'])
print(ct)

print('--------------------------------------------------------------')
colsum = ct.sum(axis=0)
colpct = ct/colsum
print(colpct*100)
print('--------------------------------------------------------------')
print('chi square value, p value, expected count')
cs = scipy.stats.chi2_contingency(ct)
print(cs)
print('--------------------------------------------------------------')

recode = {'anocracy': 'anocracy', 'democracy':'democracy' }
data['comp3'] = data['polity_cat'].map(recode)
ct = pandas.crosstab(data['femaleemployrate_cat'], data['comp3'])
print(ct)

print('--------------------------------------------------------------')
colsum = ct.sum(axis=0)
colpct = ct/colsum
print(colpct*100)
print('--------------------------------------------------------------')
print('chi square value, p value, expected count')
cs = scipy.stats.chi2_contingency(ct)
print(cs)

Initial result of Chi Square test

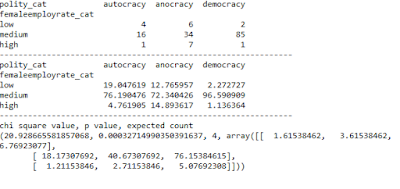
This result shows the crosstab function of female employment rate categorized as High, Medium and Low against Polity score categorized as autocracy, anocracy and democracy. We are looking at column percentages. Our initial results show that in Democracy column the female employment rate is significantly higher in the row labeled as ‘Medium’. The p Value 0.0003271499 is small enough to reject the NULL hypothesis. However we have more than one category for explanatory variable Polity score. We have 3 groups – autocracy, anocracy and democracy, hence the chi square and p value does not give us insight into why null hypothesis can be rejected. A post hoc test is required. Since there are 3 categories of the explanatory variable, we are going to make 3 comparisons. The Bonferroni adjusted p value 0.017 (0.5/3).


Results of Post Hoc test

Since there are 3 categories of the explanatory variable, 3 comparisons are made.


Anocracy VS Autocracy: The Chi Square Test value is 1.685 and p Value is 0.43, which is greater than 0.017. Hence we cannot reject the NULL hypothesis for this comparison. 


Autocracy VS Democracy: The Chi Square Test value is 10.64 and p Value is 0.004885. The p Value here is less than 0.017 hence we can reject the NULL hypothesis and accept the alternative hypothesis. This means compared to autocratic countries, democratic countries have a higher female employment rate.


Anocracy VS Democracy: The Chi Square Test value is 17.52139 and p Value is 0.000157. The p Value here again is significantly less than 0.017 and hence we ca safely reject the NULL hypothesis.

Conclusion

Chi Square test shows that polity score is in fact related to female employment rate. Democratic countries have a significantly higher female employment rate than Anocratic countries.

Saturday, October 31, 2015

Running an analysis of variance

I am using the Gapminder dataset and my response variable is FemaleEmploymentRate and Explanatory variable is Polityscore.

My hypothesis is that female employment rate is related to polity score. Polity score captures the regime authority spectrum on a 21-point scale ranging from -10 (hereditary monarchy) to +10 (consolidated democracy). Polity score is the category variable with 21 possible categories.

I have chosen to look at just the G20 countries for my research. The data set is managed accordingly.


Code


"""
Created on Fri Oct 30 06:50:52 2015 
@author: Abhishek

"""
import pandas
import numpy
import statsmodels.formula.api as smf
import statsmodels.stats.multicomp as multi

data = pandas.read_csv('gapminder.csv', low_memory=False)
pandas.set_option('display.float_format', lambda x: '%f'%x)

data['femaleemployrate'] = data['femaleemployrate'].convert_objects(convert_numeric=True)
data['incomeperperson'] = data['incomeperperson'].convert_objects(convert_numeric=True)
data['polityscore'] = data['polityscore'].convert_objects(convert_numeric=True)

dataG20Copy = data[(data['country'] == 'Argentina') |
            (data['country'] == 'Australia') |
            (data['country'] == 'Brazil') |
            (data['country'] == 'Canada') |
            (data['country'] == 'China') |
            (data['country'] == 'France') |
            (data['country'] == 'Germany') |
            (data['country'] == 'India') |
            (data['country'] == 'Indonesia') |
            (data['country'] == 'Italy') |
            (data['country'] == 'Japan') |
            (data['country'] == 'Mexico') |
            (data['country'] == 'Russia') |
            (data['country'] == 'Saudi Arabia') |
            (data['country'] == 'South Africa') |
            (data['country'] == 'Korea, Rep.') |
            (data['country'] == 'Turkey') |
            (data['country'] == 'United Kingdom') |
            (data['country'] == 'United States')]


# Not always necessary but can eliminate a setting with copy warning that is displayed
dataG20 = dataG20Copy.copy()

subPolity = dataG20[['femaleemployrate','polityscore']].dropna()

modelPolity = smf.ols(formula='femaleemployrate ~ C(polityscore)',data=subPolity).fit()
print(modelPolity.summary())

mean = subPolity.groupby('polityscore').mean()
print(mean)

sd = subPolity.groupby('polityscore').std()
print(sd)

mc1 = multi.MultiComparison(subPolity['femaleemployrate'],subPolity['polityscore'])
res1 = mc1.tukeyhsd()
print(res1.summary())


OLS Test Results


Group Means


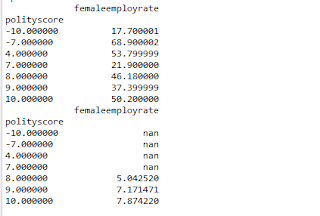
Looking at the p value, we see that there is good chance that the null hypothesis can be rejected. Post Hoc test results will determine for which categories null hypothesis can be rejected.

Turn Key HSD / Post Hoc Test Results


The Groups for which reject column is True in the above results are groups where NULL Hypothesis can be safely rejected. 

In conclusion, it is evident that Female Employment Rate is indeed dependent on Polity score of a G20 country.